Background
As I spent more time looking at kernel drivers, that interest gradually grew. Finding my first CVE in a Windows driver pushed me to pay closer attention to this area. Around the same time, I started reading more practical write-ups on driver work, including a post by eversinc33 on unpacking a VMProtected kernel driver. It was straightforward and hands-on, and it made driver research feel more concrete.
Not long after that, I saw a tweet by vx-underground mentioning roughly 48.5 GB worth of Windows drivers being processed through IOCTLance. There were no conclusions attached, just a large number of drivers and a lot of output.
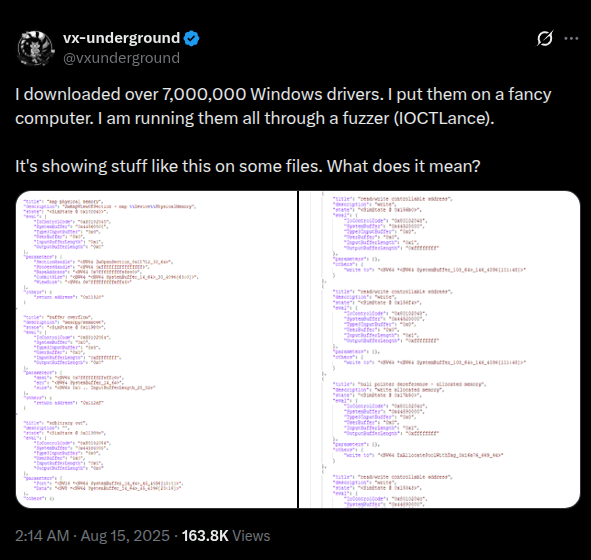
Figure 1: The spark that started it all – analyzing drivers at scale.
What stayed with me was the gap between those two ends of the spectrum. Manual driver analysis is slow but precise. Large-scale automation moves quickly, but the output often lacks context.
What started to feel interesting was a simpler idea: What if there was a system where, when you were curious about a driver, you could upload it and let it run through a set of analyses? Basic classification, some context, and a vulnerability-oriented report that gives you a place to start. Not something that replaces manual work, but something that makes it easier to decide whether a driver is worth spending time on.
That idea led to this project.
Using MWDB and Karton
Following that idea, I was introduced to MWDB and Karton.
MWDB provided a straightforward way to store samples and browse analysis results. Karton complemented that by offering a simple pipeline model for automated analysis—files are pushed in, workers consume them, and results are passed to the next stage. although this setup is typically used for malware samples, there is nothing about it that makes it specific to user-mode binaries. At its core, it is a way to move files through a pipeline and collect structured output, which also works well for drivers.
Using MWDB and Karton together meant drivers could be uploaded once, processed automatically, and stored in a central place for later exploration.
The issue was that none of the services I needed existed. There was no worker to identify Windows kernel drivers, no worker to extract driver-specific metadata, no worker to run IOCTLance in a batch-friendly way, and no worker to aggregate the results into something usable. So, those services had to be implemented.
Karton provides the framework and messaging, but the analysis logic lives entirely in the workers. Most of the work went into deciding how to break the pipeline into small stages and what information each stage should produce.
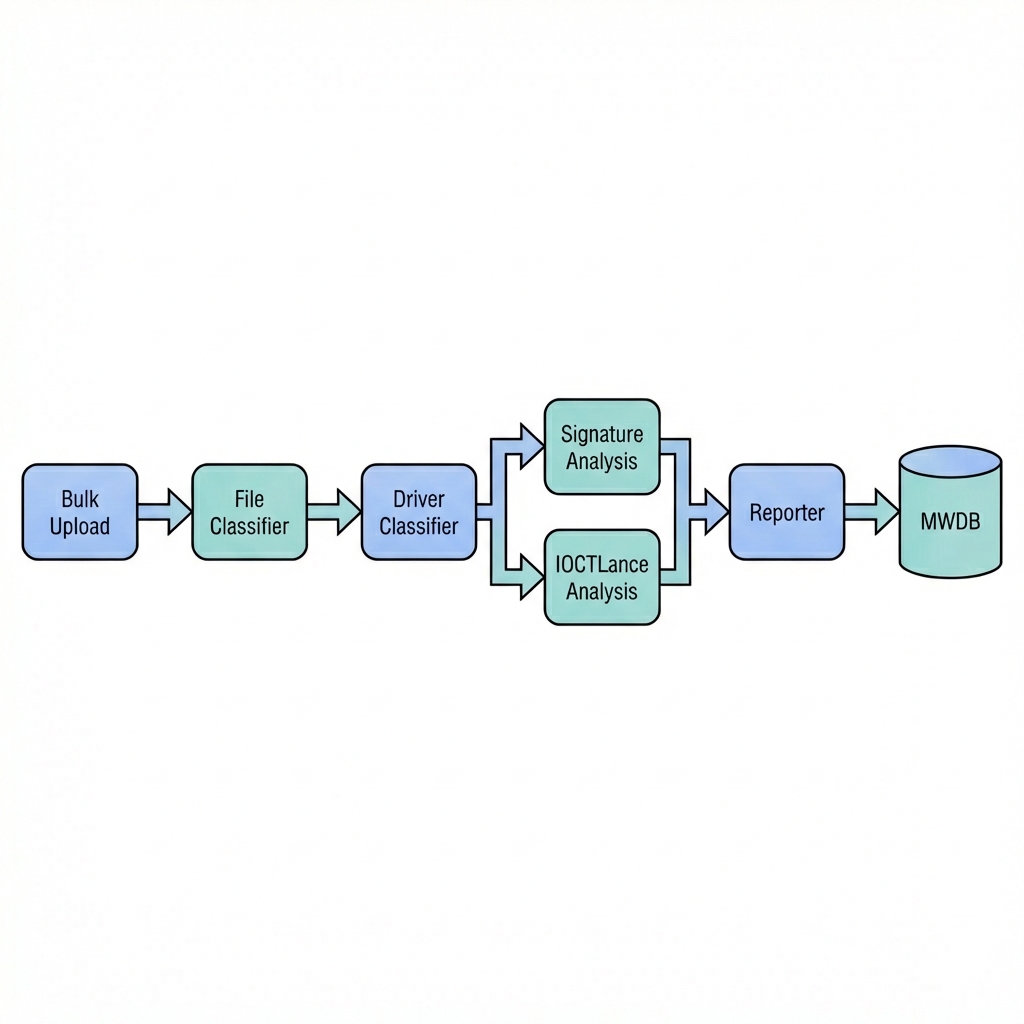
Figure 2: High-level driver analysis pipeline
Implementing the Pipeline
Each stage of the pipeline is implemented as a Karton service. Every service has a narrow responsibility and emits structured output for the next stage.
File Classification
The first service performs basic triage. It checks whether an uploaded file looks like a PE binary using simple heuristics and magic bytes. Files that do not resemble PEs are dropped at this stage to prevent unnecessary work later in the pipeline.
Driver Identification
Not all PE files are kernel drivers. The next service parses the PE headers and checks basic properties, such as the subsystem, to determine whether the file is a Windows kernel-mode driver. Only confirmed drivers continue. This stage exists to filter, not to validate correctness.
Signature and Metadata Extraction
For confirmed drivers, the next step is metadata extraction. This service runs sigcheck64.exe via Wine and extracts available information such as signature status, signer name, product name, version, and description strings. This metadata is not used to make security decisions; it exists to provide context and make later grouping and filtering possible.
IOCTL Analysis
The IOCTL analysis stage wraps IOCTLance. For each driver, IOCTLance symbolically executes DriverEntry, locates IOCTL dispatch routines, and explores handler code paths. The goal is to surface patterns commonly associated with risky behavior rather than to fully explore every path.
This stage is slow and noisy by nature. Timeouts and incomplete exploration are expected. Each run produces a structured JSON report describing what was explored and which paths appeared interesting.
Reporting and Storage
The final service aggregates outputs from all previous stages. It applies tags, attaches artifacts, and stores the results in MWDB. At this point, drivers can be browsed and filtered by metadata or analysis results, making it easier to move from bulk ingestion to targeted exploration.
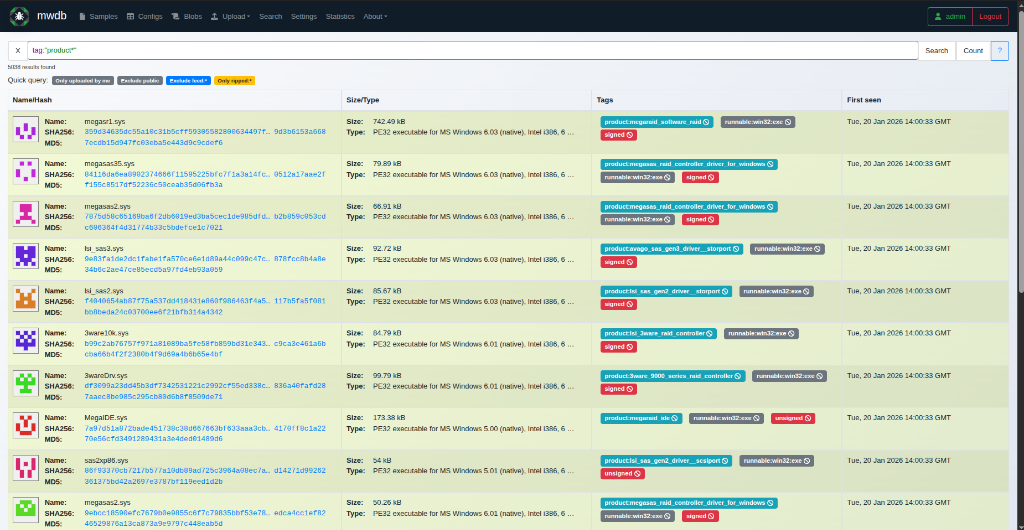
Figure 3: MWDB list view showing processed drivers and basic metadata.
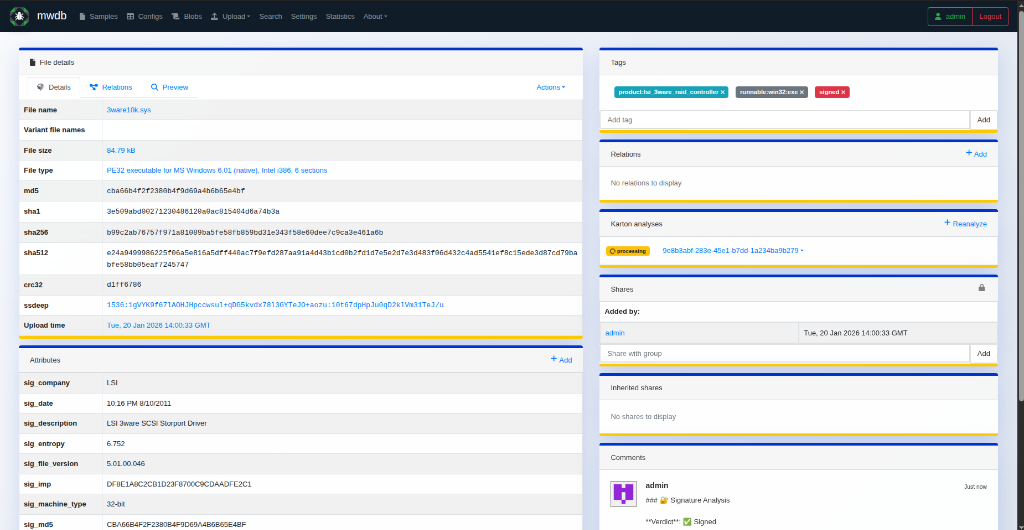
Figure 4: Driver sample page with extracted metadata and analysis artifacts.
Integration Challenges & Solutions
Getting the pipeline to run smoothly wasn’t just about writing analysis code. Integrating these tools required solving several specific constraints.
1. MWDB Permissions and Custom Metadata
MWDB is strict about what data can be uploaded. By default, even admin users might not have permissions to add custom tags or define new metadata attributes on the fly. I had to implement a bootstrap script to:
- Grant the
admingroup capabilities likeadding_tags,adding_parents(critical for attaching analysis artifacts), andadding_all_attributes. - Explicitly register custom metakeys (e.g.,
ioctl_vuln_count,sig_product,sig_verifier) before the reporter service could use them. Without this registration, the reporter would silently fail or log errors when trying to push detailed context.
2. Product Tagging
One goal was to group drivers by their product name (e.g., “GeForce”, “Razer Synapse”). However, raw strings from PE version info are often messy, containing spaces, special characters, or inconsistent casing. I implemented a sanitization layer in the Reporter service that uses regex to normalize these strings into valid MWDB tags (e.g., converting ” Razer Synapse 3 ” to product:Razer_Synapse_3). This ensures that the tags remain clickable and useful for filtering.
3. Handling Analysis Artifacts with Karton
Passing large analysis results between workers can be tricky. Instead of stuffing the full IOCTLance JSON report into the task payload (which can overload the message broker), I utilized Karton’s resource system. The IOCTLance worker attaches the full raw report as a Resource, which is efficiently stored in MinIO and passed by reference. The Reporter worker then retrieves this resource and uploads it as a child object in MWDB to the analyzed sample. This establishes a parent-child relationship, keeping the main sample clean while allowing the full JSON report to be viewed directly within the MWDB UI.
Current State
At the time of writing, the pipeline is running. The services are deployed and processing input. Tens of gigabytes of drivers are being uploaded and analyzed, and MWDB is being populated with results.
This post focuses on the design and setup of the system. Observations from running the pipeline at scale will be covered in Part 2.

Leave a comment